Websites as graphs
Filed Under Art, Geek, Websites on 2008-04-08, 12:45
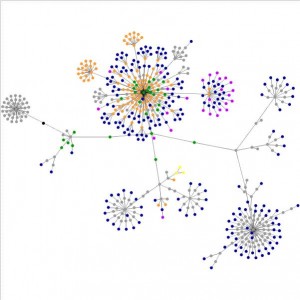
Here’s something that’s kind of neat, representing websites as a graph of points. There’s a nifty script that will make one for you by just providing it with a URL. Here is geeked.info (click to enlarge):
You can also download the source code and run it on your local machine to create a larger, higher resolution image that’s suitable for posters, t-shirts, coffee mugs, etc.
If you want to check out more of these, there’s a flickr pool of course. Some of them are quite aesthetically pleasing. If you’re wondering what each node stands for, here’s the legend from the site:
What do the colors mean?
blue: for links (the A tag)
red: for tables (TABLE, TR and TD tags)
green: for the DIV tag
violet: for images (the IMG tag)
yellow: for forms (FORM, INPUT, TEXTAREA, SELECT and OPTION tags)
orange: for linebreaks and blockquotes (BR, P, and BLOCKQUOTE tags)
black: the HTML tag, the root node
gray: all other tags
Thanks for pointing this site out exiva
